Morphology-and-morphometry-of-the-hepatopancreas-of-O

Description:
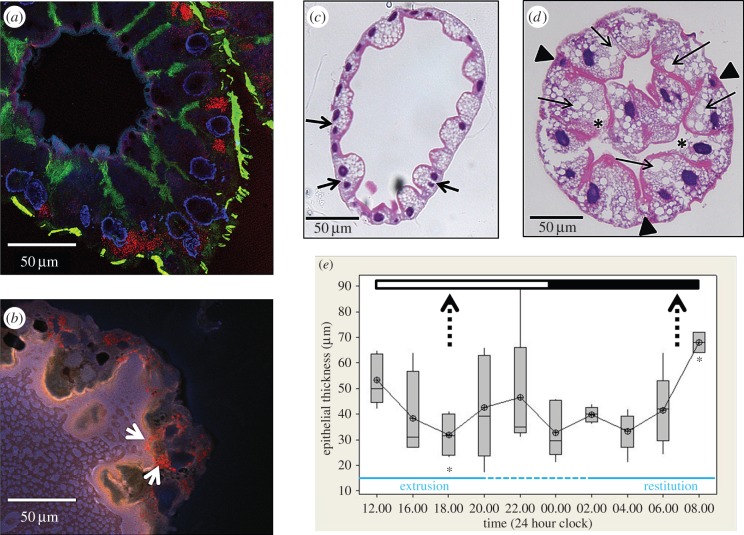
Morphology and morphometry of the hepatopancreas of O. asellus . ( a ) Confocal image of an unfixed, cryostat-sectioned hepatopancreas tubule immunofluorescently stained to illustrate general cell architecture. Note that nuclei are stained blue (DAPI) and actin filaments green (Alexa Fluor ® 488 nm phalloidin). Cuprosomes (red) in the ‘S' cells were imaged in reflectance mode. The tubule was dissected from a woodlouse near the peak of its restitution phase. ( b ) Confocal image of part of an unstained cryostat section taken from alongside the section depicted in 1( a ) showing autofluorescence only; no fluorescent markers were introduced. Punctate red staining within the cytoplasm of a B cell (white arrows) represents autofluorescent lipid-containing droplets (note that the lumen is the lighter, left-hand side of the image). This fluorescence had an unusually long Stokes shift, being excited by the UV laser and emitting in the red part of the spectrum. ( c ) Light micrograph of a transverse H&E-stained section of a tubule near the nadir of the extrusion phase; note the variability in the shapes of the binucelate B cells (arrows), but with all containing small lipid inclusions. ( d ) Light micrograph of a transverse H&E-stained section of a tubule near the climax of the restitution phase where the apical cytoplasm of the B cells is engorged with large lipid inclusions (arrows); note the B cells (asterisks) with disrupted apical membranes that are apparently undergoing apocrine secretion, and the S cells (arrowheads). ( e ) Box-plot of the modelled epithelial thickness of the hepatopancreas of acclimated woodlice measured ( n = 6) at regular intervals during a 24 h period; the dark and light phases are depicted at the top, and the observed extrusion and restitution phases depicted at the bottom (with the ‘intermediate’ region where hepatopancreas morphology was variable indicated by a broken line); the broken vertical arrows pinpoint the equivalent physiological periods identified by Hames & Hopkin [ 36 ] where restitution bottoms out (left) and extrusion climaxes (right); the asterisks indicate that the two points in our morphometric dataset nearest the Hames and Hopkin physiological transition regions are significantly different (Mann–Whitney, p
Included On The Following Pages:
- Life
- Cellular
- Eukaryota (eukaryotes)
- Opisthokonta (opisthokonts)
- Metazoa (animals)
- Bilateria
- Protostomia (protostomes)
- Ecdysozoa (ecdysozoans)
- Arthropoda (arthropods)
- Pancrustacea
- Multicrustacea (typical crustaceans)
- Malacostraca (malacostracans)
- Eumalacostraca
- Peracarida (peracarids)
- Isopoda (isopods)
- Oniscidea (woodlice)
- Oniscidae (sowbugs)
- Oniscus
- Panarthropoda
- Oniscus asellus (Common woodlouse)
This image is not featured in any collections.
Source Information
- license
- cc-by-3.0
- copyright
- P. Kille, A. J. Morgan, K. Powell, J. F. W. Mosselmans, D. Hart, P. Gunning, A. Hayes, D. Scarborough, I. McDonald, J. M. Charnock
- creator
- P. Kille, A. J. Morgan, K. Powell, J. F. W. Mosselmans, D. Hart, P. Gunning, A. Hayes, D. Scarborough, I. McDonald, J. M. Charnock
- original
- original media file
- visit source
- partner site
- Wikimedia Commons
- ID